Water in TEG Performance Test Report
ZT-100TEG validation: 0–1% water content in triethylene glycol with Intertek lab correlation
In May 2025, Zelentech conducted a controlled performance test of the ZT-100TEG Water in TEG Monitor on a purpose-built flow loop. Water was added to triethylene glycol in precise 0.1% increments from 0% to 1% by volume. The meter output was logged continuously and samples were collected at each step for independent laboratory analysis by Intertek.
The test demonstrated that the ZT-100TEG reliably detects step changes in water content at 0.1% resolution and tracks linearly across the 0–1% range. Lab correlation confirmed the meter readings are consistent with independent laboratory results when accounting for the weight-to-volume conversion and single-point sampling limitations.
Test Setup
The test was performed on a purpose-built flow loop designed for water cut meter and TEG monitor testing. The loop uses a 30-litre tank with a 1.25″ flow circuit and an adapter for the ZT-100 I-Series probe.
- Instrument: ZT-100TEG I-Series (production unit, order 2833)
- Media: New TEG as supplied by NORSK
- Contamination: Drinking water, added by volume
- Loop volume: 20 litres starting volume
- Loop pressure: ~1 bar through sensor
- Pump rate: 38 Hz (80% capacity)
- Temperature: ~40 °C (TEG pre-heated before filling)
- Logging: One sample every 10 seconds (water content + temperature)
The test loop includes a ¼″ sample valve immediately downstream of the probe location for collecting ~50 ml spot samples into glass bottles at each water addition step.
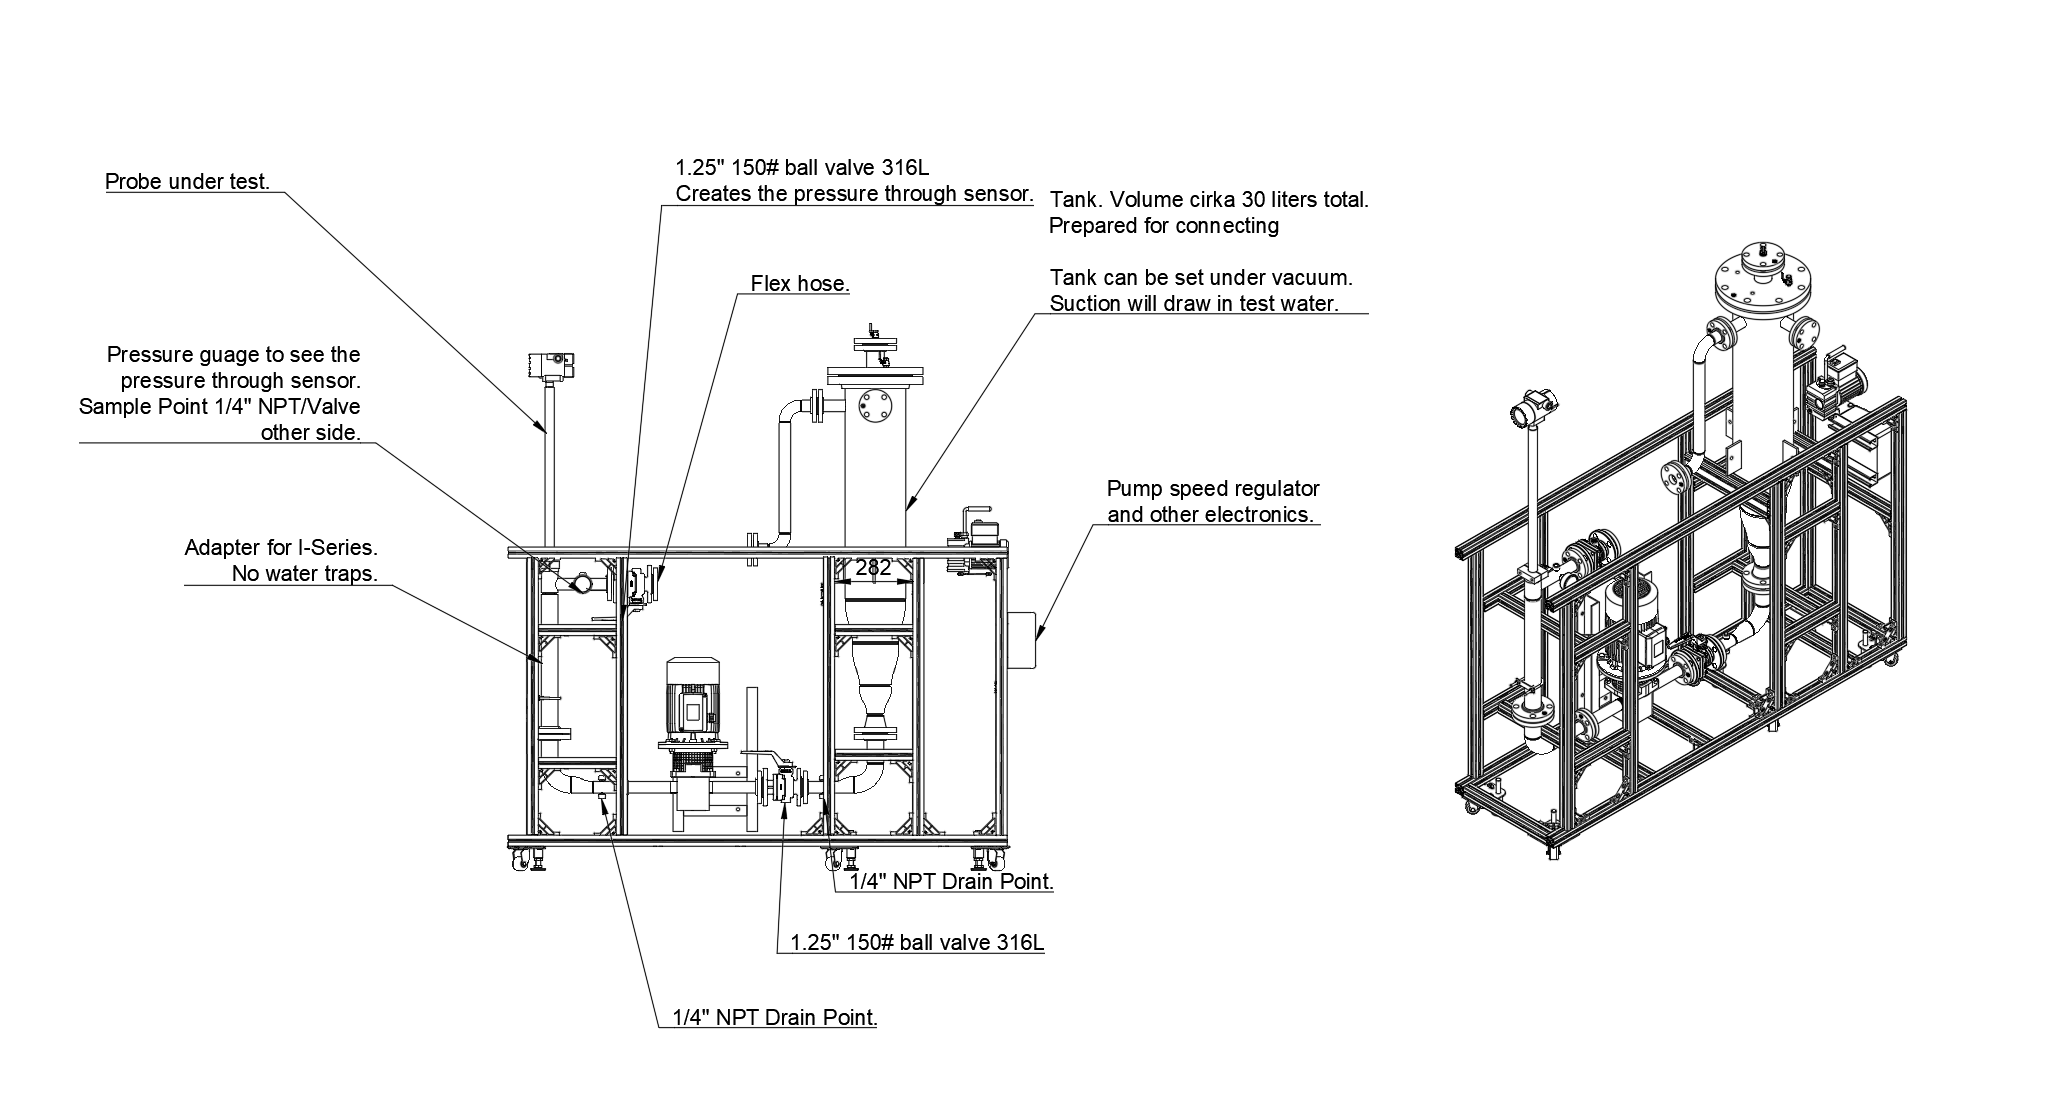
Test loop schematic (left) and assembled flow rig (right)
Test Procedure
Fill & Stabilise
Fill loop with 20 litres of new TEG, pre-heated to ~40 °C. Run pump until temperature stabilises with no water added.
Add Water
Add 20 ml of drinking water per step (0.1% increments). Allow 5–20 minutes per step for mixing and stabilisation.
Log & Sample
Continuously log meter output at 10-second intervals. Collect a ~50 ml spot sample at each step through the sample valve.
Lab Analysis
Send all collected samples to Intertek for independent water content analysis. Compare lab results with meter output and known volumes added.
Test Run 1 — 29 May 2025
The first test run covered the full 0–1% range with 11 water addition steps at approximately 5-minute intervals. The chart below shows the raw meter output (blue) and the averaged reading at each step (orange). Each step change is clearly visible, demonstrating the meter’s ability to resolve 0.1% increments in water content.
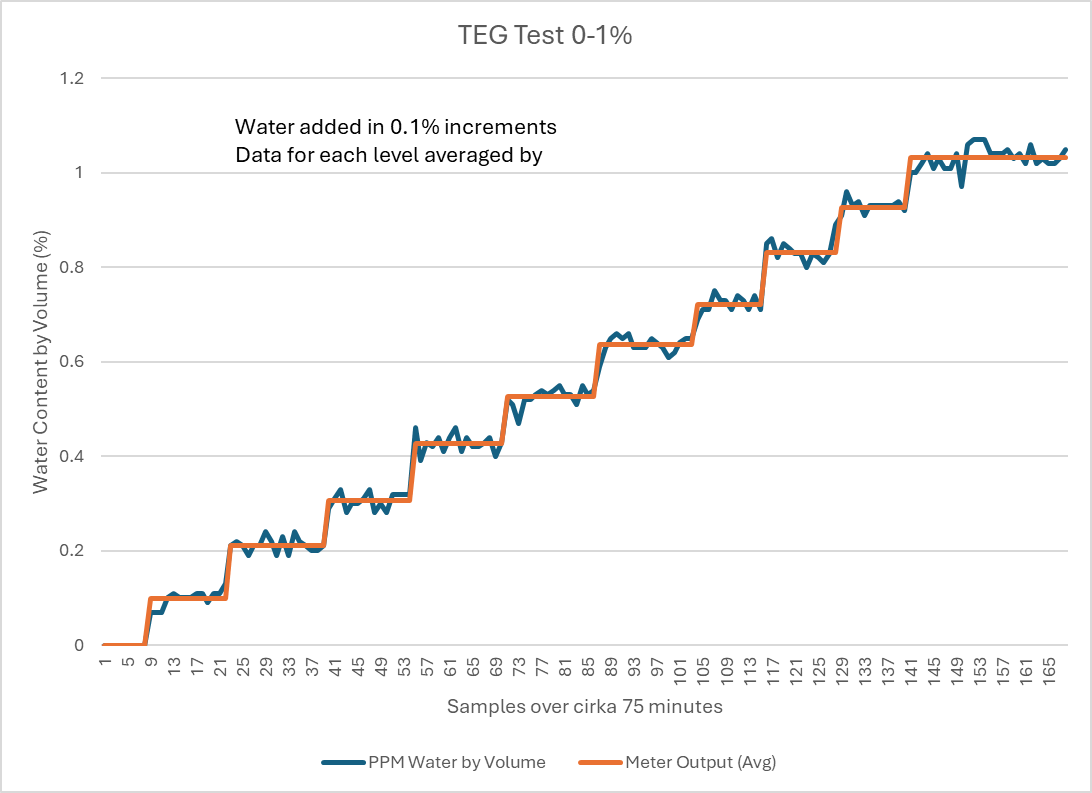
Test Run 1: 75 minutes, ~5 minutes per level. Water added in 0.1% increments from 0% to 1%.
Test Run 1 — Water Addition Log
| Water Added (ml) | Accumulated (ml) | Total Volume (ml) | Water Content (%) | Time |
| 0 | 0 | 19,950 | 0.00% | 14:25 |
| 20 | 20 | 19,970 | 0.10% | 14:32 |
| 20 | 40 | 19,940 | 0.20% | 14:40 |
| 20 | 60 | 19,910 | 0.30% | 14:45 |
| 20 | 80 | 19,880 | 0.40% | 14:54 |
| 20 | 100 | 19,850 | 0.50% | 15:00 |
| 20 | 120 | 19,820 | 0.61% | 15:07 |
| 21 | 141 | 19,791 | 0.71% | 15:15 |
| 20 | 161 | 19,761 | 0.81% | 15:21 |
| 21 | 182 | 19,732 | 0.92% | 15:26 |
| 20 | 202 | 19,702 | 1.03% | 15:32 |
50 ml sample extracted at each step (except 0.1%). Volumes adjusted accordingly.
Test Run 2 — 30 May 2025
A second test was conducted the following day with extended dwell time at each step (~20 minutes) to provide a longer stabilisation period and examine measurement noise at each level. This test covered 0%, 0.1%, and 0.2% water content.
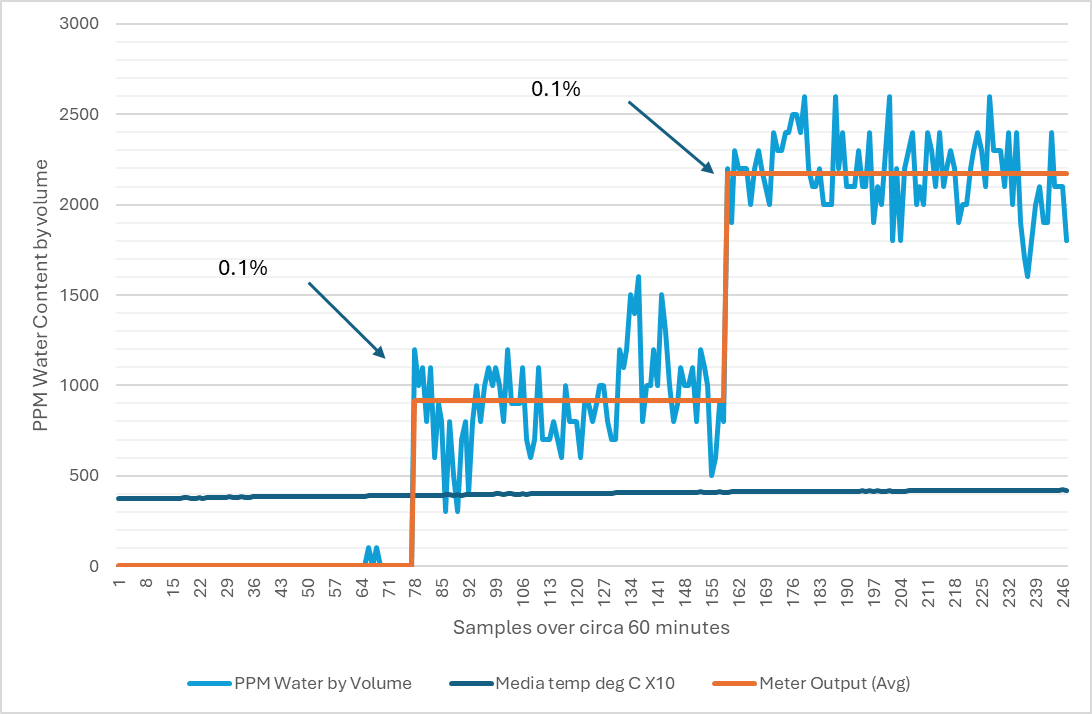
Test Run 2: 60 minutes, ~20 minutes per level. Clear step-change detection at each 0.1% addition.
The extended dwell time shows that each step stabilises to a consistent reading with minimal drift. The step transitions from 0% to 0.1% and from 0.1% to 0.2% are distinct and immediate.
Independent Lab Correlation — Intertek
All spot samples collected during both test runs were sent to Intertek for independent water content analysis. Lab reports were received on 18 June 2025.
Weight vs Volume
Intertek reports results by weight (ppm). The ZT-100TEG measures and reports by volume. TEG density at 40 °C is approximately 1.12 g/cm³. Results were converted from weight to volume by dividing by the TEG specific gravity.
Single Spot Samples
Each lab sample is a single ~50 ml spot sample from the circulating TEG/water mixture. Unlike continuous proportional sampling used in custody transfer, a single spot sample has inherent representativeness limitations and should be viewed as an indication rather than an absolute reference.
Zero-Point Calibration
In field service, the meter is calibrated to an initial lab result (the “fix point”). The test results are therefore zero-adjusted to show step-change accuracy — which is what matters in practice. The absolute baseline offset is eliminated by field calibration.
Test Run 1 — Meter Output vs Lab Result vs Known Volume Added
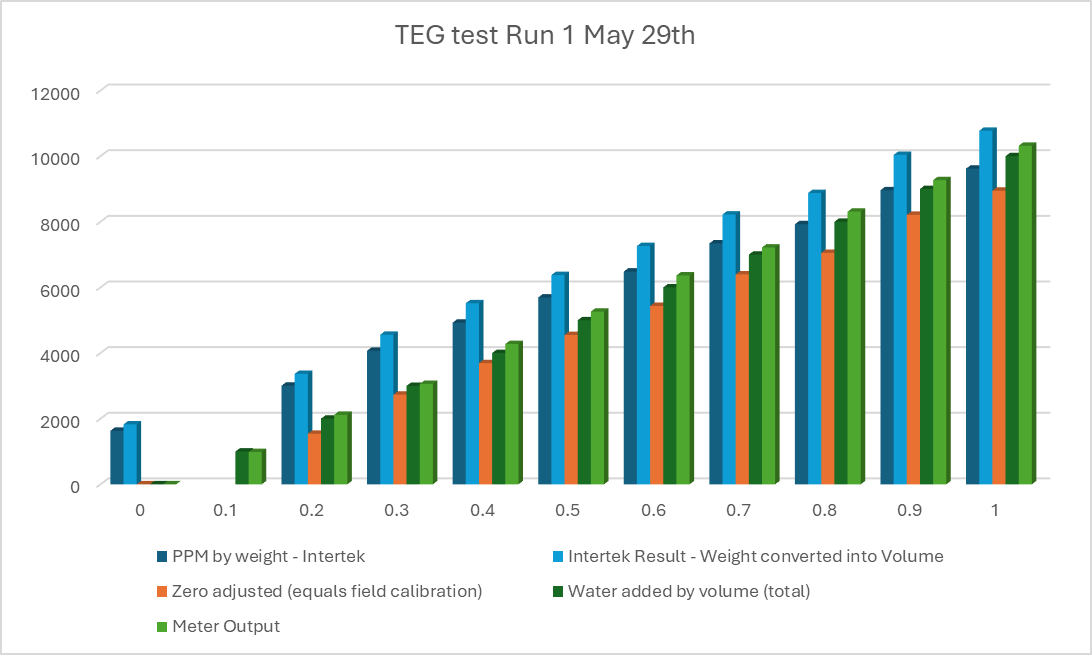
| % Added | Intertek (ppm wt) | Converted to Volume (ppm) | Zero-Adjusted (ppm) | Water Added (ppm vol) | Meter Output (ppm) |
| 0% | 1,630 | 1,826 | 0 | 0 | 0 |
| 0.1% | — | — | — | 1,000 | 986 |
| 0.2% | 3,005 | 3,366 | 1,540 | 2,000 | 2,118 |
| 0.3% | 4,070 | 4,558 | 2,733 | 3,000 | 3,060 |
| 0.4% | 4,927 | 5,518 | 3,693 | 4,000 | 4,275 |
| 0.5% | 5,693 | 6,376 | 4,551 | 5,000 | 5,263 |
| 0.6% | 6,483 | 7,261 | 5,435 | 6,000 | 6,365 |
| 0.7% | 7,341 | 8,222 | 6,396 | 7,000 | 7,217 |
| 0.8% | 7,926 | 8,877 | 7,052 | 8,000 | 8,308 |
| 0.9% | 8,962 | 10,037 | 8,212 | 9,000 | 9,269 |
| 1.0% | 9,619 | 10,773 | 8,948 | 10,000 | 10,318 |
Test Run 2 — Meter Output vs Lab Result
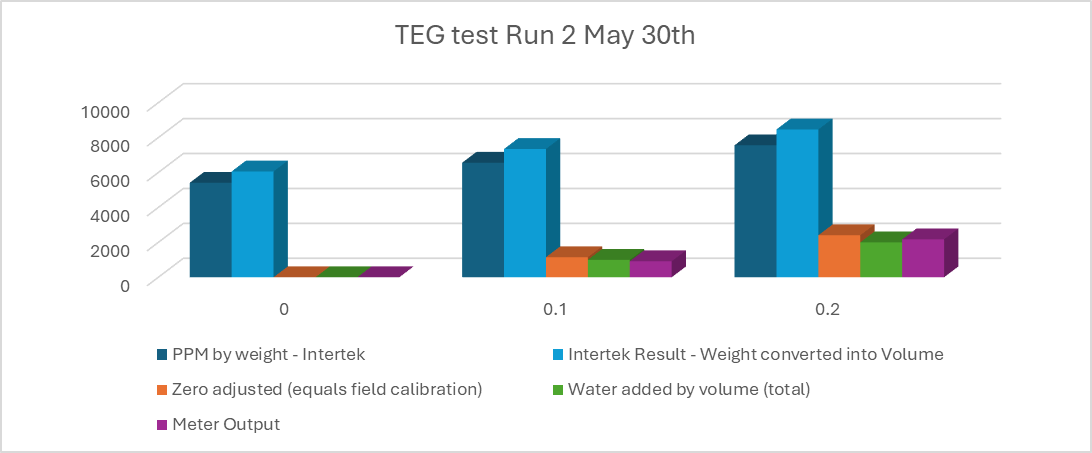
Test Run 2 started with elevated residual water from Day 1 (~0.4% baseline). Step changes remain clearly detectable.
Key Observations
Step-Change Resolution
The ZT-100TEG clearly resolves each 0.1% water addition step across the entire 0–1% range. Both the 5-minute and 20-minute dwell time tests show unambiguous step transitions with rapid response.
Linear Tracking
The meter output tracks linearly with the known volume of water added. The averaged meter output closely follows the expected water content at each step, confirming the linearity of the capacitance-based measurement in TEG.
Lab Correlation
Intertek lab results confirm the water content at each step is consistent with the volume added. Minor discrepancies are attributed to spot sampling limitations and the weight-to-volume conversion. The meter output aligns well with both.
Residual Water (Day 2)
Test Run 2 started with ~0.4% residual water from incomplete draining. This demonstrates the importance of field calibration: the meter is set to read whatever the lab tells it at the baseline, and step changes from that point are what matter for process monitoring.
Lab Samples
Spot samples were collected in ~50 ml glass bottles at each water addition step and sent to Intertek for independent water content analysis. The bottles below show the samples as labelled during the test.

29 May 2025 — Samples at 0.0% to 0.5%
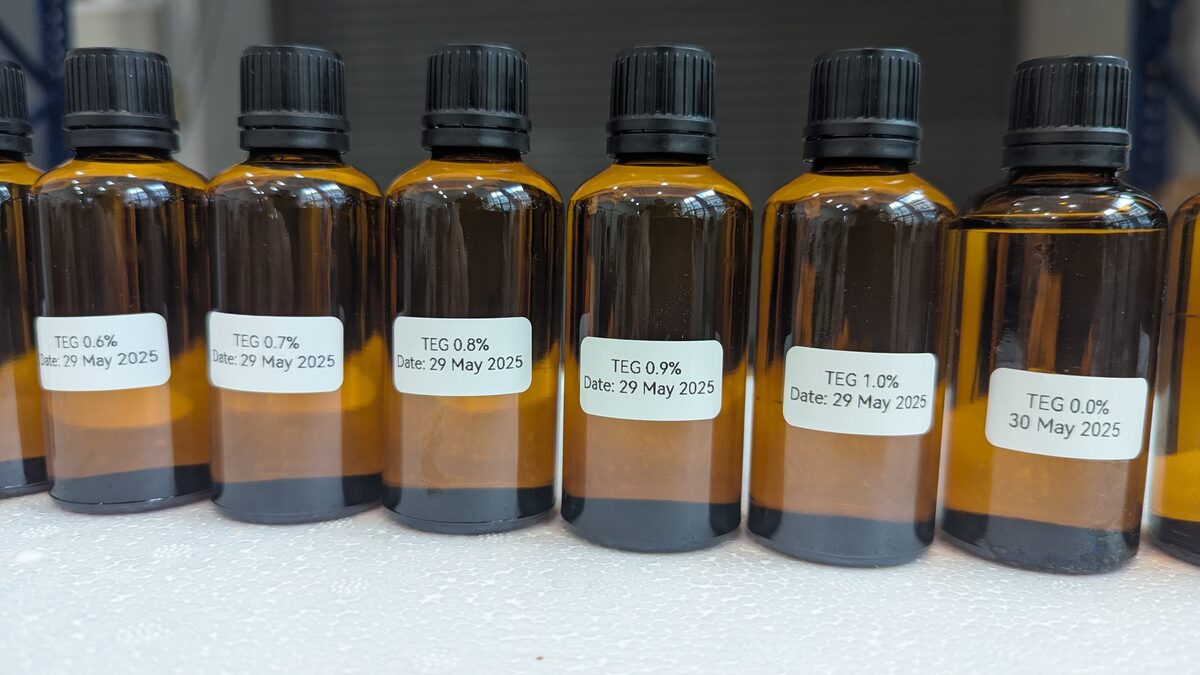
29 May 2025 — Samples at 0.6% to 1.0%
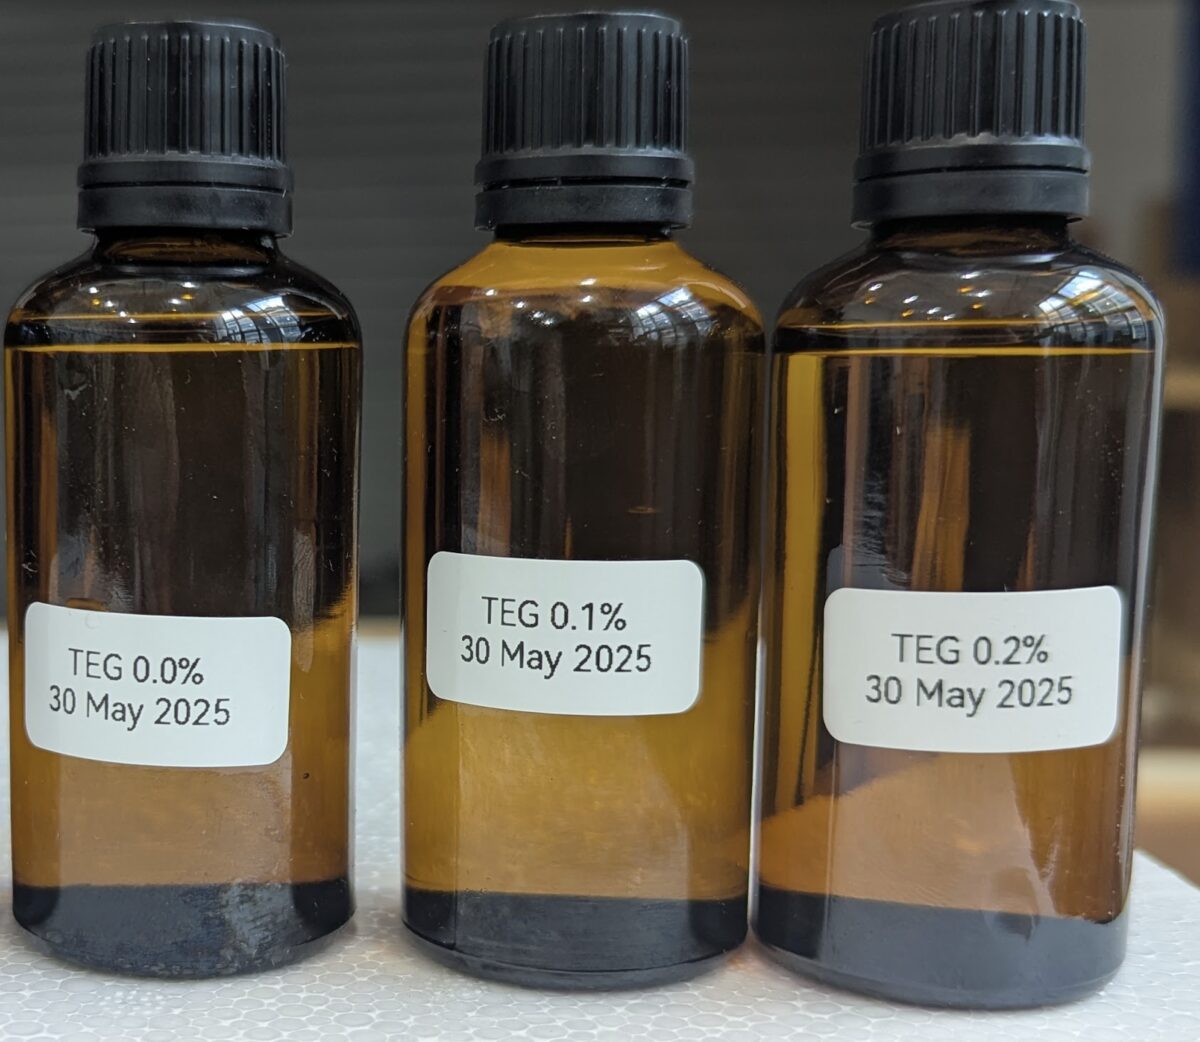
30 May 2025 — Samples at 0.0%, 0.1%, 0.2%
Conclusion
The ZT-100TEG Water in TEG Monitor demonstrated reliable, repeatable measurement of water content in triethylene glycol across the 0–1% range. The meter resolves water content changes as small as 0.1% (1,000 ppm) with clear step-change response and linear tracking. Independent laboratory analysis by Intertek confirmed the accuracy of the measurement when properly zero-calibrated.
For field installations, the ZT-100TEG is calibrated to a baseline lab sample at commissioning. From that reference point, the instrument provides continuous, real-time water content data for process monitoring, reboiler optimisation, and glycol quality assurance in natural gas dehydration systems.
29–30 May 2025
Intertek (report received 18 June 2025)
Zelentech Pte Ltd, Singapore
Order 2833
Ready to Monitor Your TEG System?
Contact our engineering team to discuss installation options for the ZT-100TEG in your glycol dehydration system.